Tobias Selg
COO Digital Signage & Communication
Digital signage is sold as a screen. In practice, it operates as a networked system of power supply, network connection, media player, signal extender and content delivery: five components, any one of which can fail. Twelve months of operational data show which digital signage KPIs really matter.
We analysed this data and measured the key digital signage KPIs: twelve months of operational data from our entire network and one quarter of real audience measurement at a customer site.
1. How often does digital signage actually fail?
2. What does a failure mean for the people it was supposed to reach?
The most important figure first: the communication availability of our network is approximately 99.996 percent, calculated from twelve months of support tickets and CMS playout data. This exceeds the pure device availability of 99.95 percent and is well above the status snapshot of approximately 92 percent — the share of screens reported as "online" at any given moment. Three figures from the same data. The fact that they differ so widely is not a contradiction, but the actual technical core of this article.
How many times does a display point play content in a year?
Almost one million. A single display point plays content approximately one million times in a year. With a typical operating time of twelve to sixteen hours per day, that amounts to around 2,400 to 2,900 plays daily.
This figure was verified against two independent sources: the content management system of jls digital and the playout log of the audience measurement system. Both align in their order of magnitude — evidence that no single source is skewing the result.
A display point runs almost unnoticed. Until it doesn't.
When does digital signage fail, and what is usually the cause?
The failure rate is lower than expected. Around 16 support tickets arise per 100 display points per year. A single display point is statistically affected once every six years. Approximately 87 percent of all display points had no ticket at all in twelve months.
When disruptions do occur, network components are the cause in 54.5 percent of all support tickets: routers, LTE (Long-Term Evolution, mobile broadband standard), Wi-Fi or signal boosters. Only 16.2 percent of tickets concern the display itself, and 6.3 percent the media player.
The real weak point in a digital signage installation is not the expensive panel. It is the connection behind it.
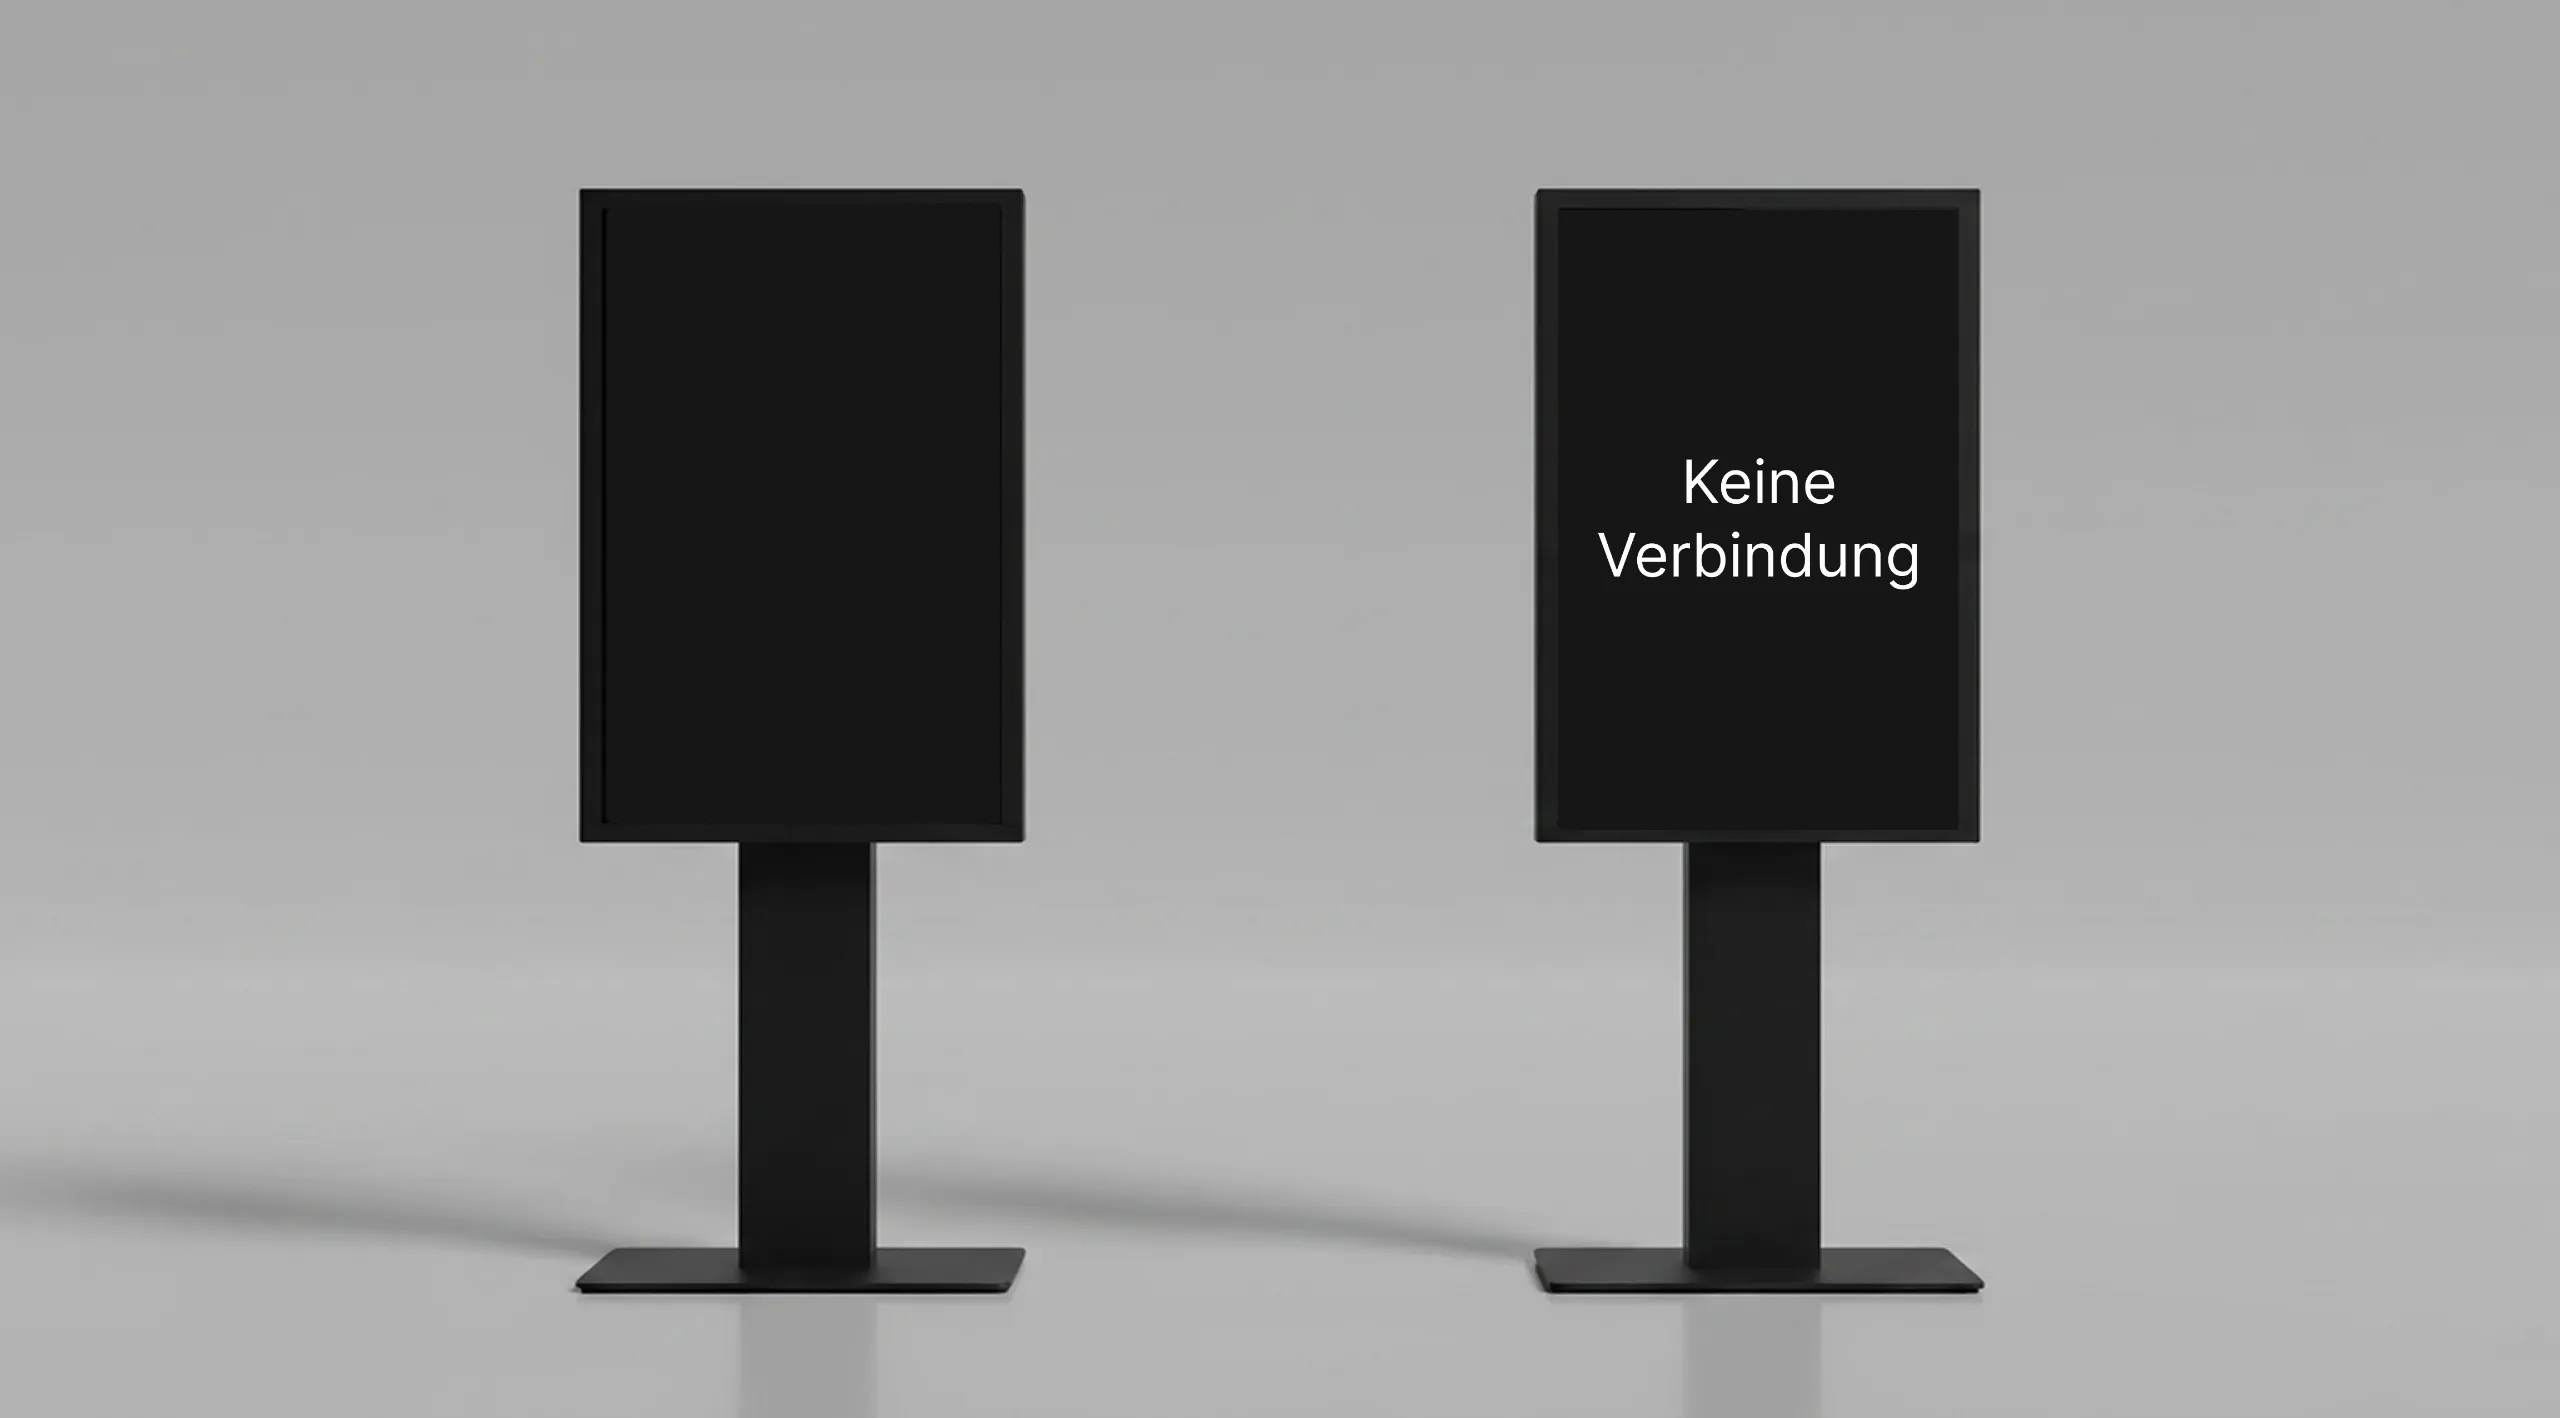
What happens to the screen when the connection drops?
This is the core finding of this analysis — and it corrects a widespread assumption, including our own from an earlier version of these figures.
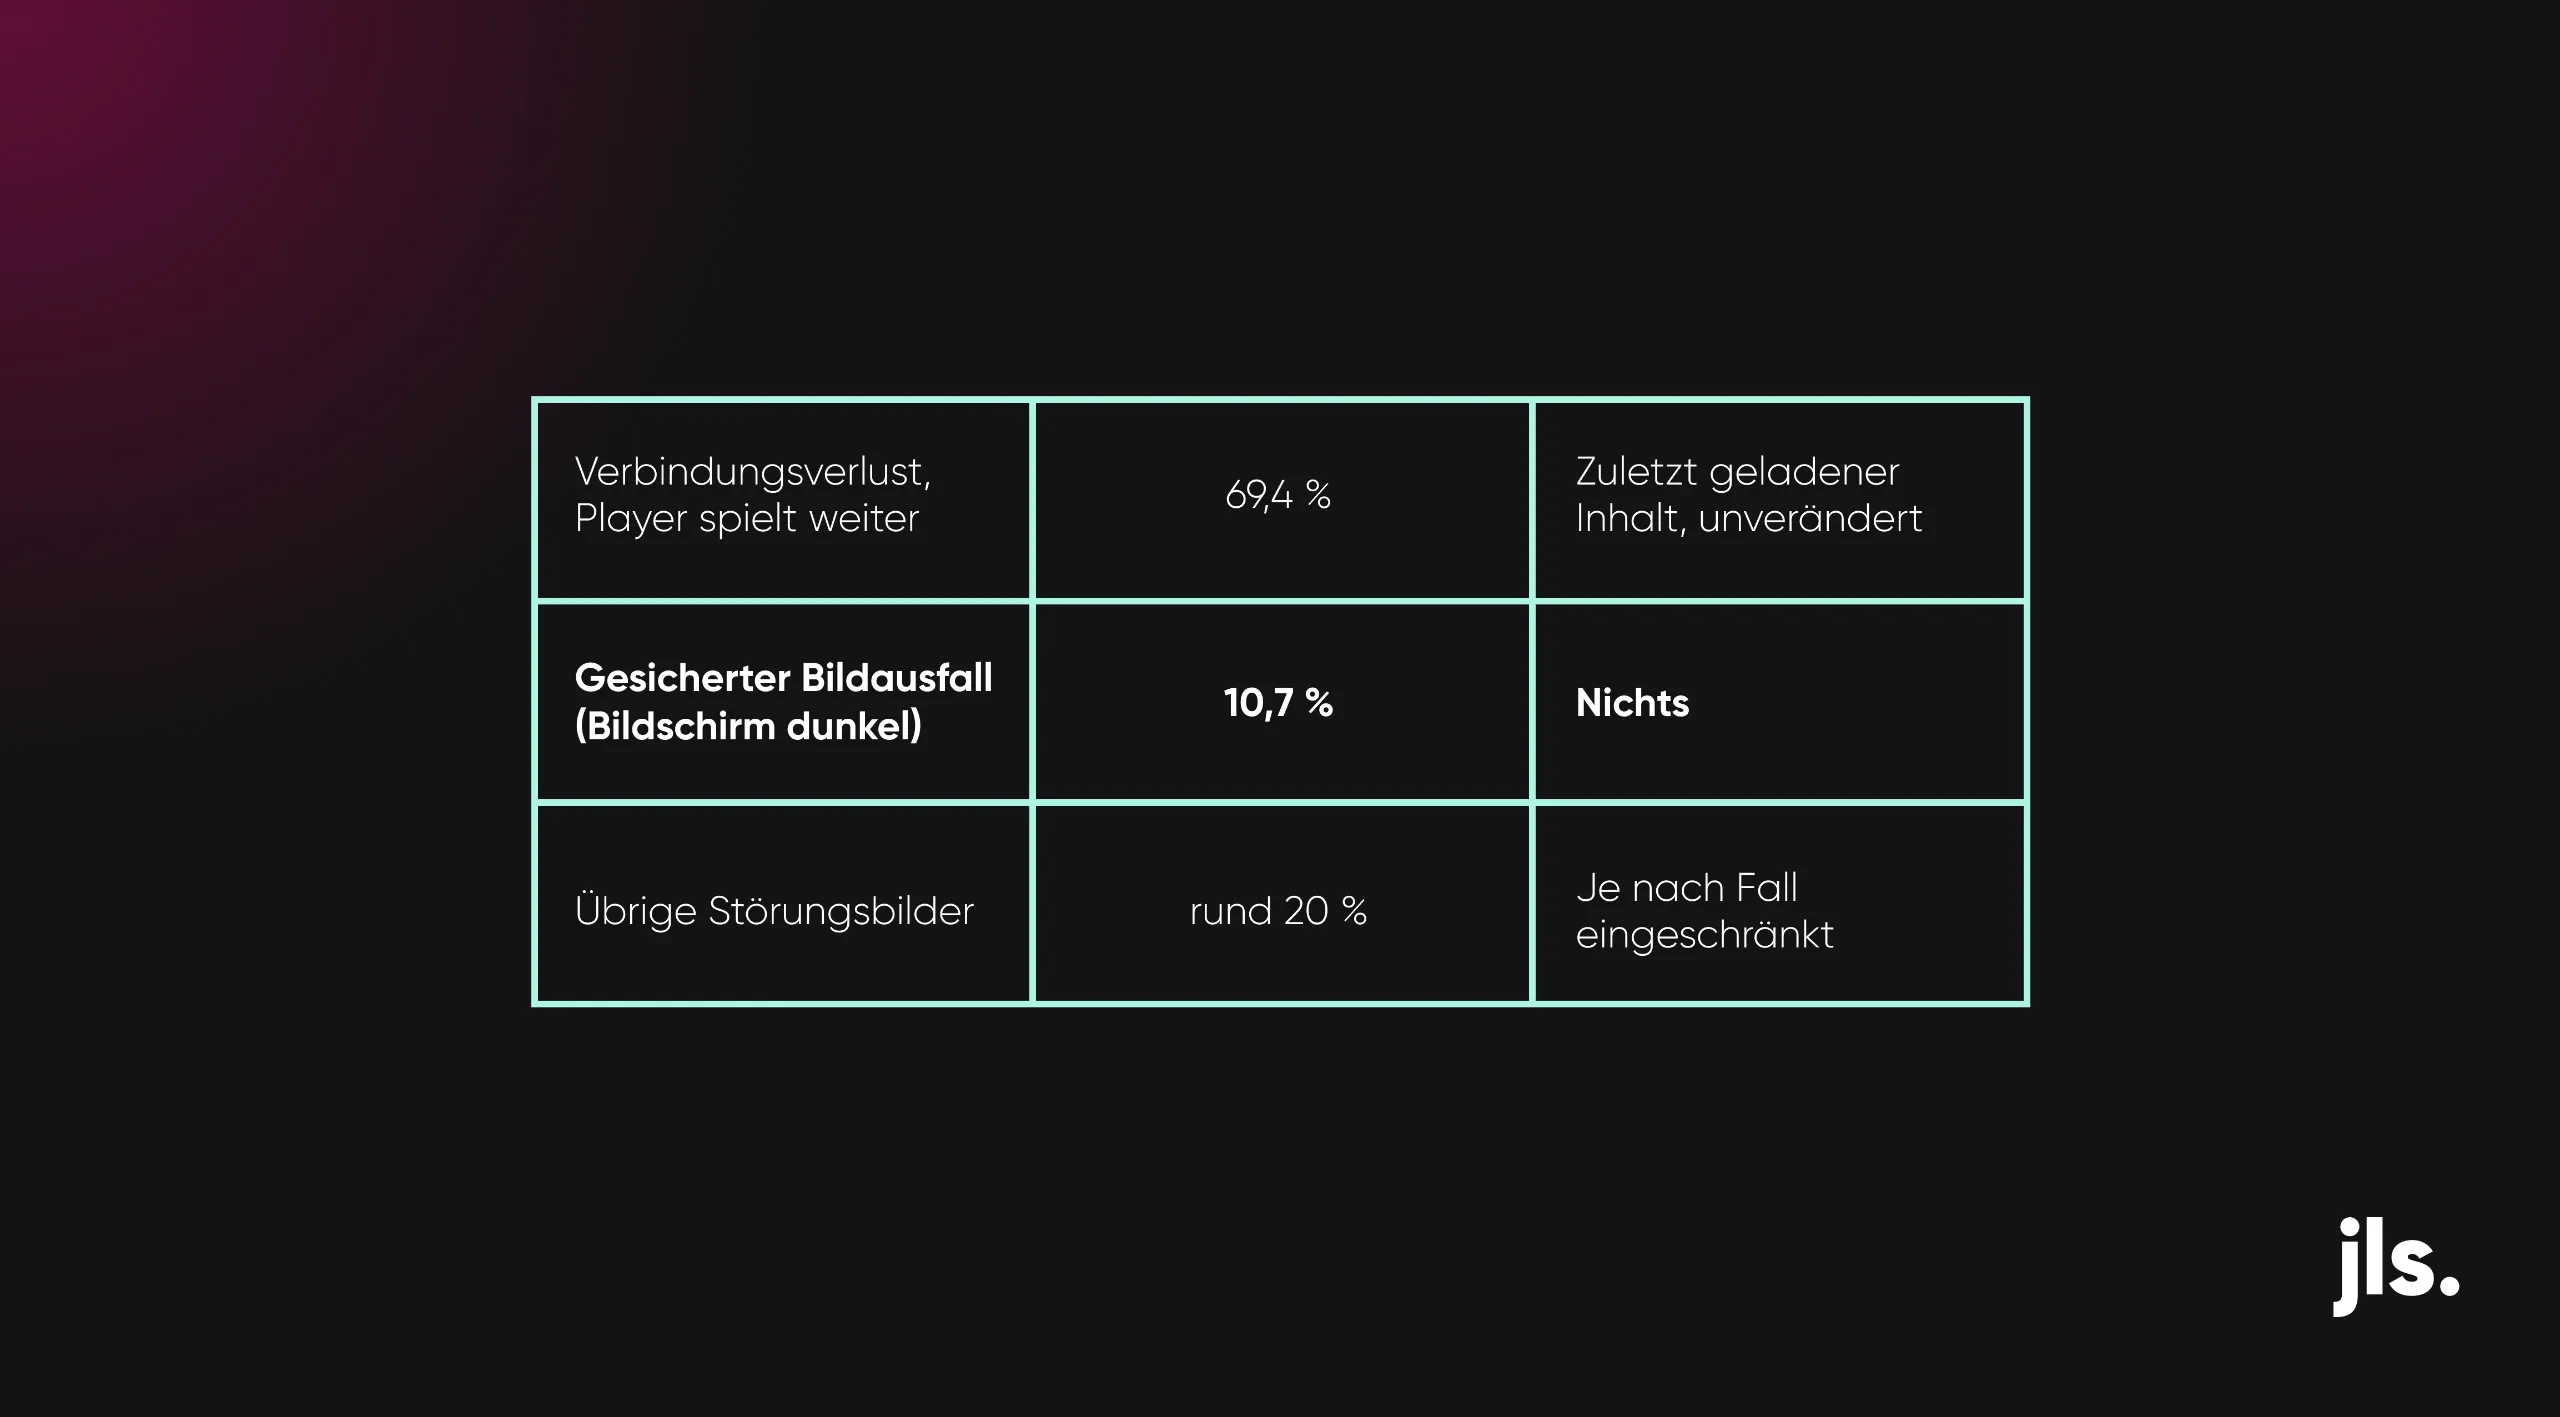
When a player loses its connection to the content management system, it does not switch off. It continues playing the last loaded playlist independently. From the viewer's perspective, nothing changes. What is lost is not the playout, but currency: newly published content only reaches the player once the connection is restored.
A genuine communication failure — a screen that is actually dark — occurs in only 10.7 percent of all disruption cases. This corresponds to approximately 1.7 cases per 100 display points per year.
Source: jls digital ag, support ticket analysis, 12 months.
Anyone who counts all support tickets as communication failures overestimates the actual contact loss by a factor of 7.3. This metric is decisive: it determines whether a failure is treated as a communication issue or a pure IT event.
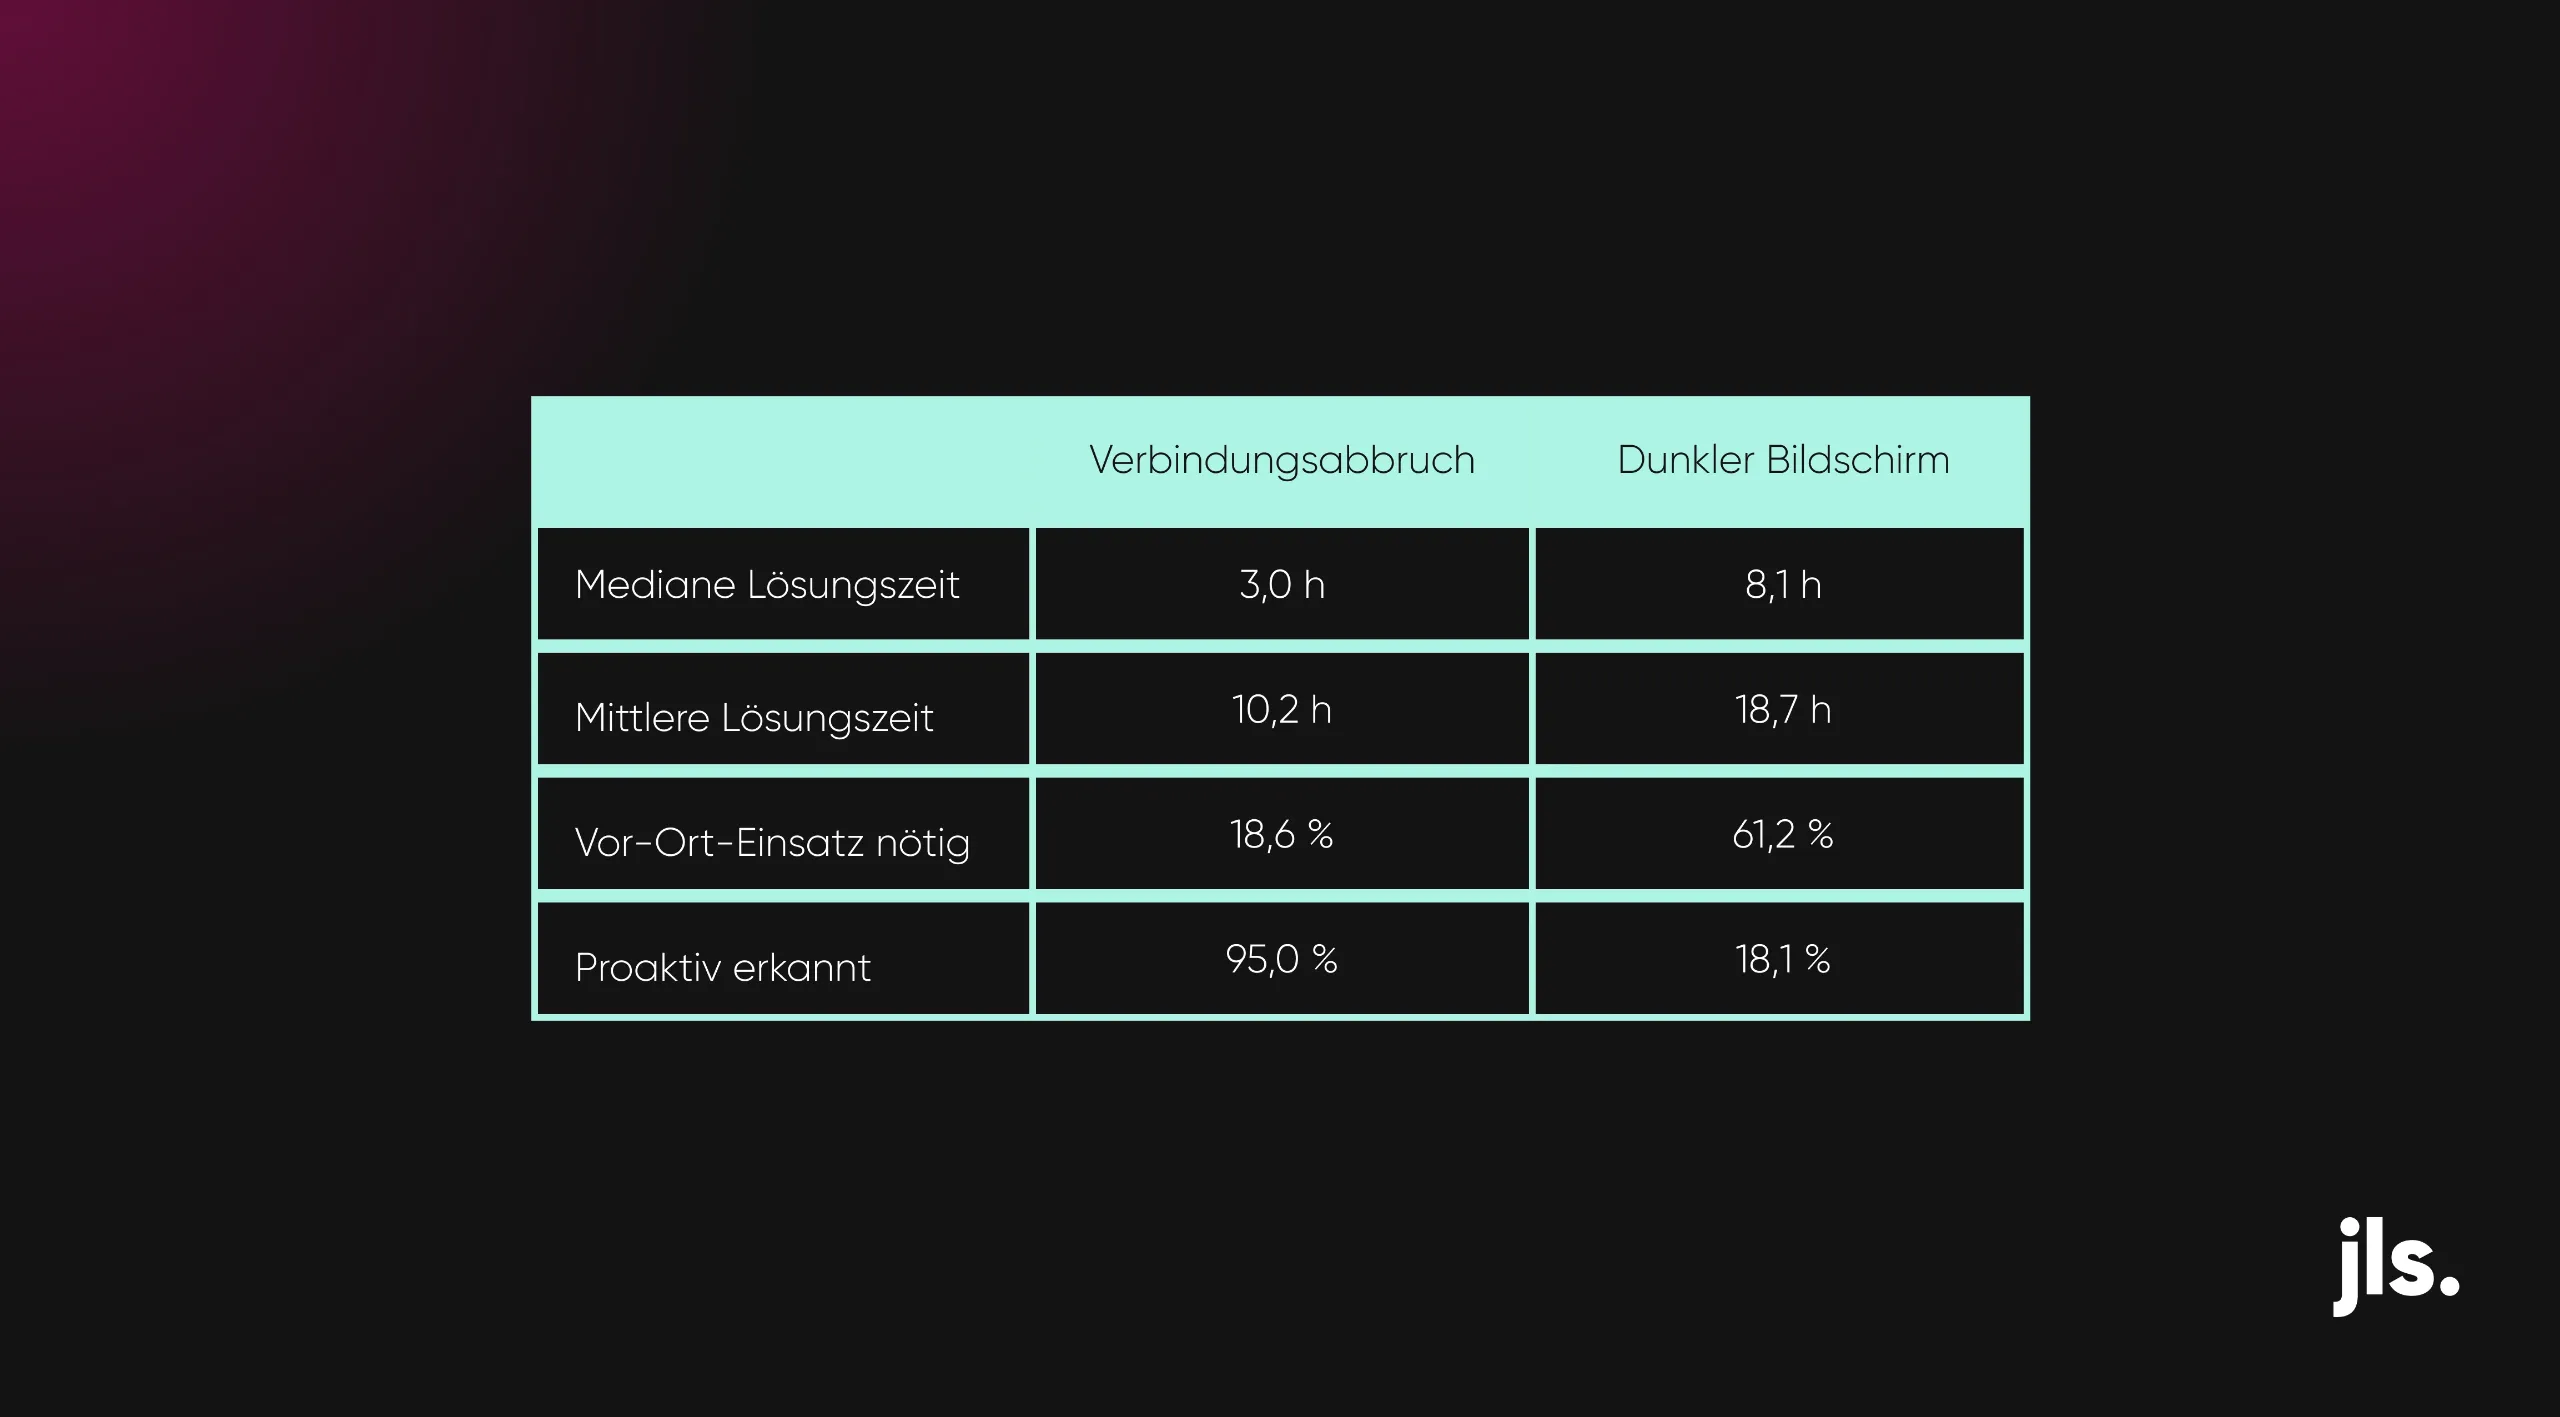
Why is a dark screen harder to resolve than a connection drop?
Why is a dark screen harder to resolve than a connection drop?
Because it typically has a different root cause — one that remains invisible to monitoring.
Source: jls digital ag, support ticket analysis, 12 months.
In four out of five confirmed screen outages, it is a person on site who reports the disruption, not the monitoring system. The cause is in most cases not a hardware defect, but an unplanned interruption to the power supply — for example due to renovation work, a refurbishment or other interventions at the location. When the power goes, so does the network connection, and the system simply registers "unreachable" rather than "screen dark". This type of disruption cannot be treated with the same priority, partly because brief network interruptions occur frequently and partly because no further analysis is possible in the meantime.
This has a direct consequence: the reported number of confirmed screen outages is a lower bound. A dark screen that nobody reports never appears in any statistic.
Why do so many support tickets appear on Monday all at once?
Not a single support ticket was opened on a Saturday or Sunday over twelve months. Monday accounts for 26.5 percent of all tickets — significantly more than any other weekday. This is not a measurement artefact but a process pattern: ticket creation follows the service window, not the time of the disruption.
And here is the figure that makes this significant: in the measured customer network, 16.1 percent of all audience contacts fall on Saturday and Sunday. A disruption that begins on Saturday morning only becomes visible in the system on Monday — even though one sixth of the audience was active in the meantime.
Once a disruption is identified, resolution is fast: half of all cases are resolved within four hours, and 78.1 percent without any on-site visit.
How many audience contacts does a single playout generate?
We analysed a signage network in a retail environment with more than ten locations over a full quarter using real audience measurement, referenced to the individual display point and the individual playout.
Three digital signage KPIs show how strongly the contact value varies: a playout is not a fixed unit. Its actual contact value depends heavily on when, where and what is played.
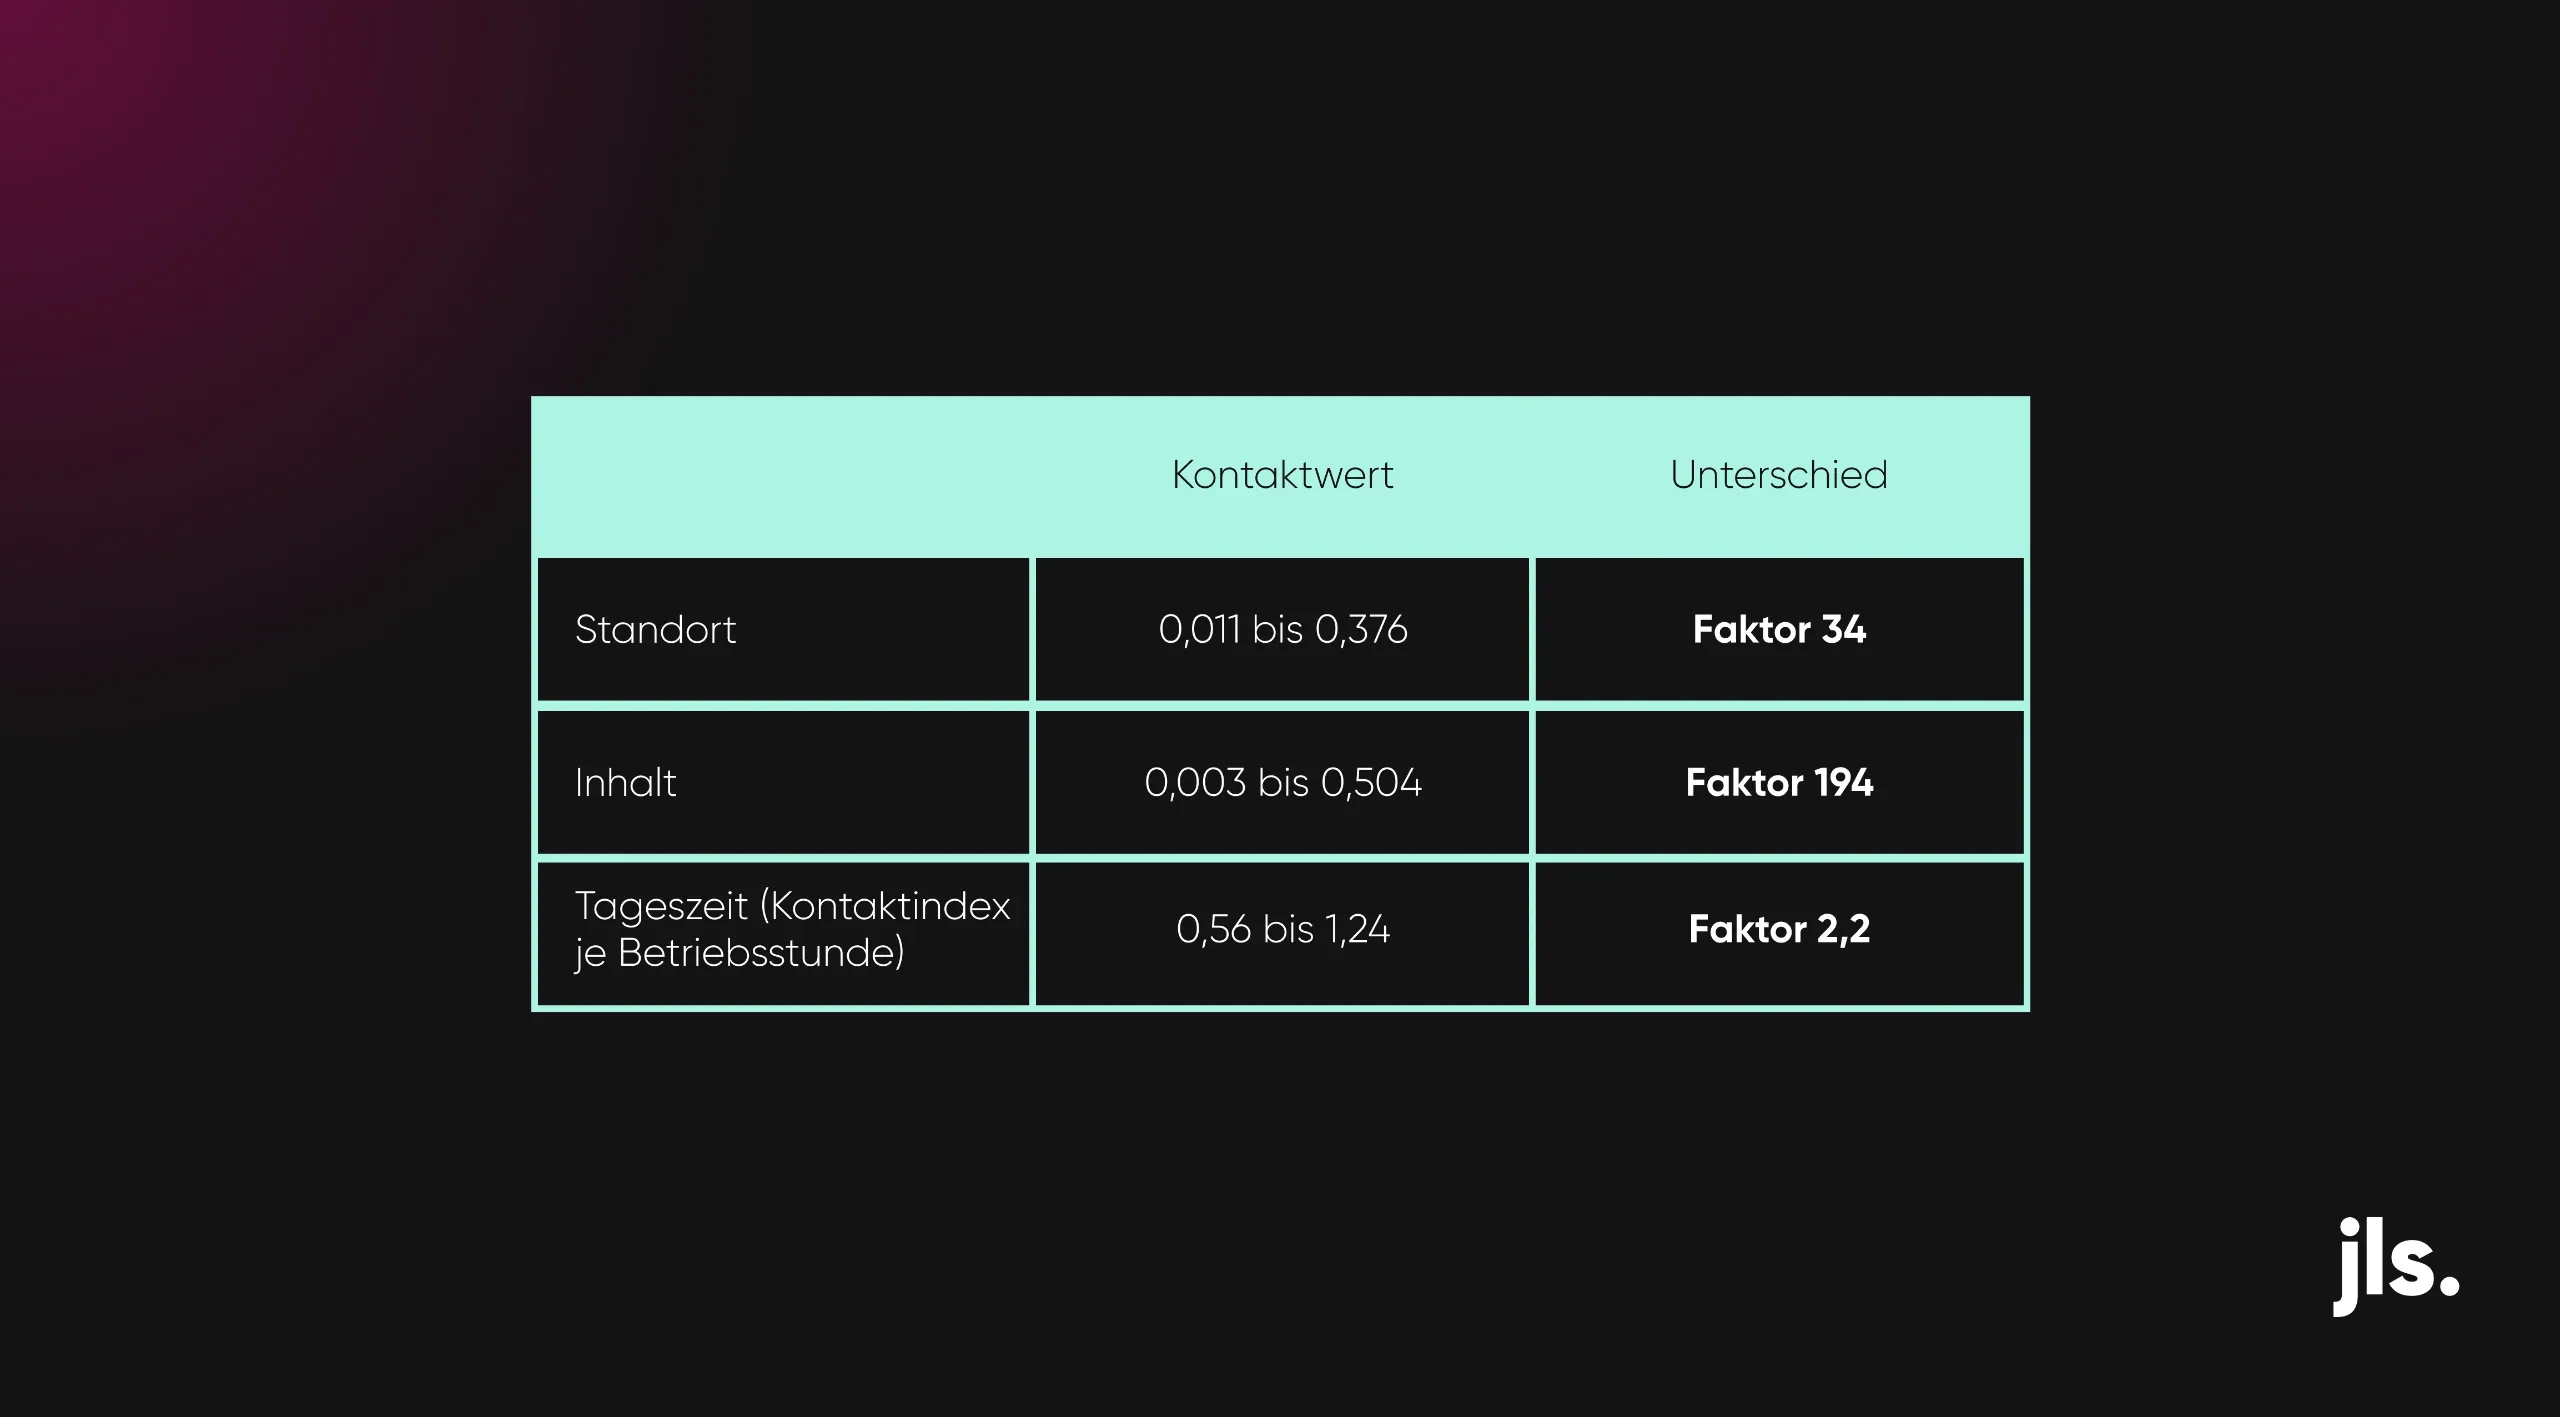
Source: jls digital ag, audience measurement, 1 quarter, retail network of 10+ locations. Variance = ratio of highest to lowest measured value.
Die zwanzig Inhalte mit dem tiefsten gemessenen Kontaktwert, also jene unterhalb der mittleren Effizienz im untersuchten Netz, belegten 39 Prozent aller Ausspielungen, erzeugten aber nur 14,4 Prozent aller Sichtkontakte. Fast vier von zehn Ausspielungen leisten zusammen weniger als ein Siebtel der Kontaktarbeit. Nicht weil der Inhalt schlecht wäre, sondern weil stark lokal zugeschnittene Inhalte oft an Standorten mit wenig Frequenz laufen.
How much attention does a digital signage spot actually receive?
A spot runs for approximately twenty seconds on average. It receives an average of approximately 5.6 seconds of actual attention.
This figure only becomes calculable through the sensor manufacturer's definitions: a viewer counts from one second of measured attention, a qualified viewer from two seconds. Attention is distributed across an average of 1.45 clips, resulting in 5.62 seconds per viewed clip. The average spot duration of approximately 20 seconds is derived from playout volume and confirmed by the independent playlist analysis in the jls digital CMS.
Approximately one quarter to one third of a spot is therefore actually seen. For content design, this means: the core message belongs at the start. Everything after that is, on average, a bonus.
A further reproducible finding: service information such as opening hours holds attention four to five times longer than standard campaign content — presumably because it is actively sought. This does not automatically make it a better advertising medium, but it makes it a reliable anchor for everything else.
What does a digital signage outage cost in audience contacts?
This allows the digital signage KPIs for communication loss to be quantified precisely. An average display point in the jls digital measured network generates approximately 209 audience contacts per day, around 16 per operating hour.
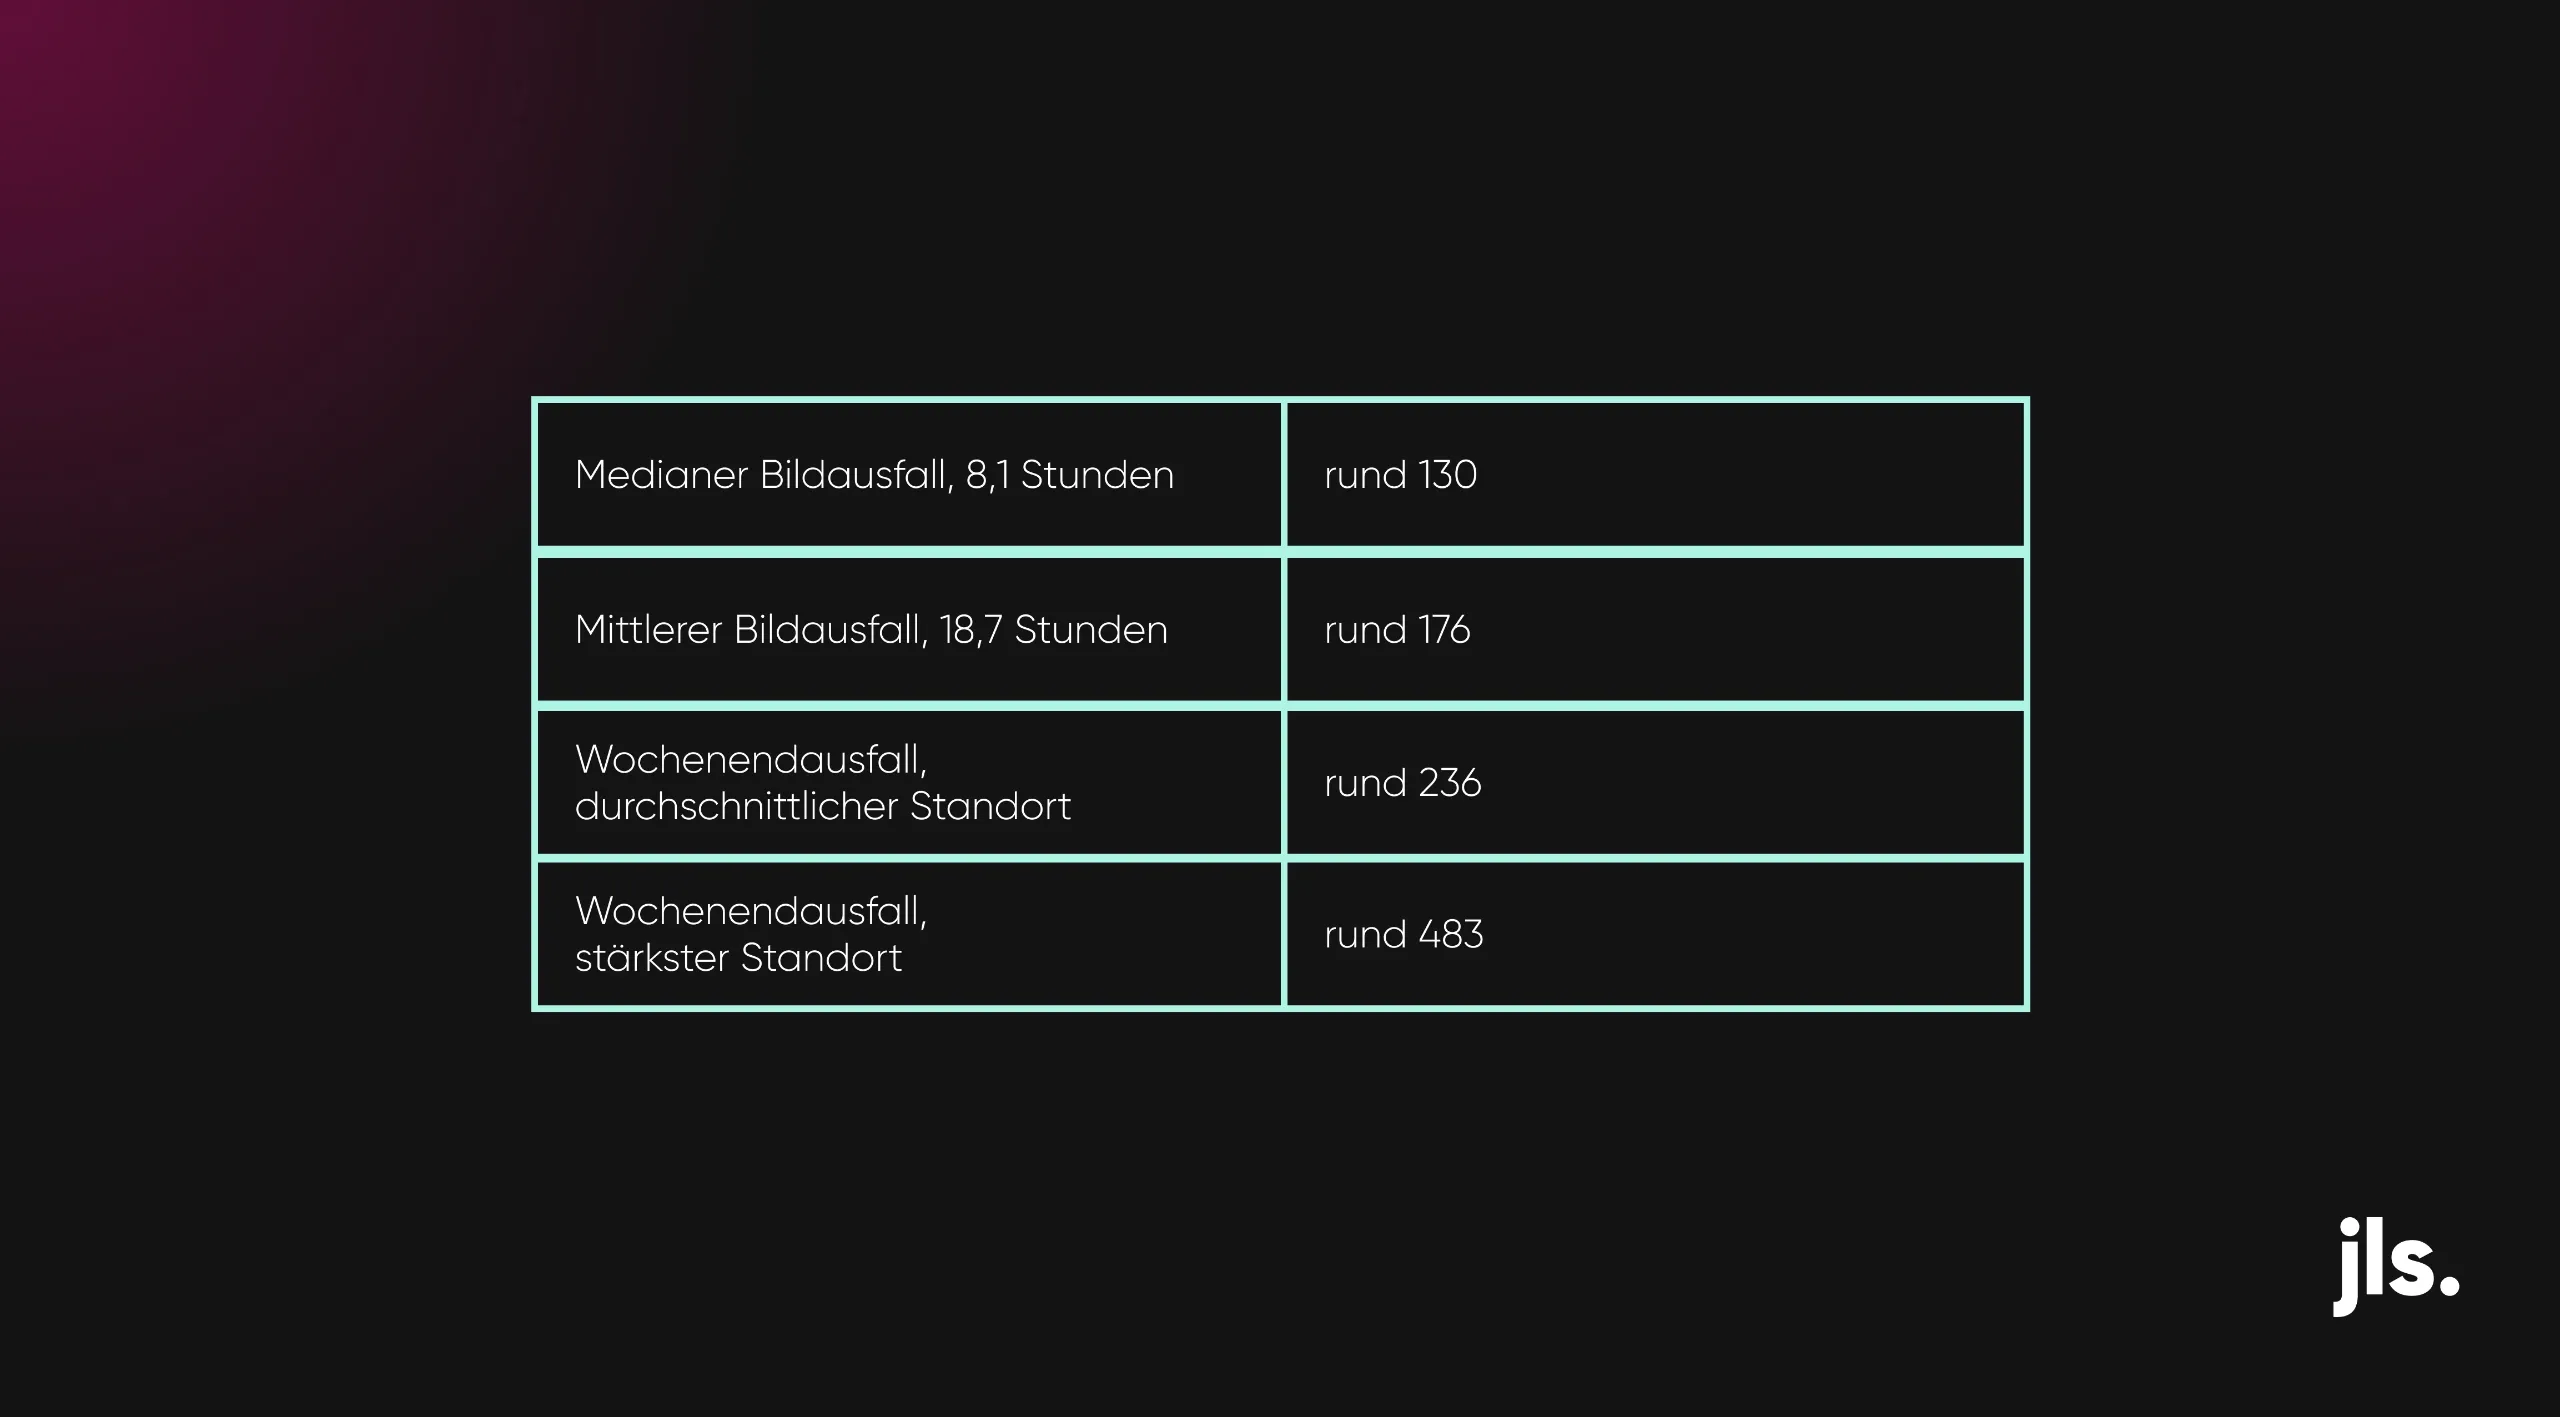
Source: jls digital ag, audience measurement and operational data, combined analysis.
Equal-length outages cost up to 3.5 times as many contacts depending on the time of day. Location matters more than duration: a four-hour outage at the strongest location costs more contacts than a day-and-a-half outage at the weakest.
Across the entire network, fewer than 0.005 percent of all planned playouts are actually lost. The loss is marginal in aggregate and real in individual cases — especially at high-footfall locations and during operating hours with high target audience frequency.
A pure connection loss, by contrast, costs not a single contact — but potentially currency: in approximately one in nine cases, it lasts longer than 24 hours. The screen continues to communicate throughout, at full contact capacity, but with content that may be outdated.
Which measures reduce digital signage outages most effectively?
Anyone who consistently analyses digital signage KPIs recognises the difference early. A disruption is not a pure technical event, but one of two very different communication events. Either the screen goes silent — that is rare and costly. Or it keeps saying something, possibly from yesterday — that is common and less severe, but not free.
1. The most costly and least well-detected type of disruption does not arise from a hardware defect, but from an unplanned intervention in the on-site installation — for example renovation work that interrupts the power supply. Clear agreements before such work is the single most effective lever against costly outages.
2. It is worth tailoring content to each specific location rather than distributing it evenly across the network. The contact value varies by a factor of 34 depending on location. Content running where nobody is looking is wasted, regardless of how well it is made.
The question at the end is not whether the screen is running. The question is whether it is showing the right thing — and how many people would have seen it in that hour.
Interested in an exchange on the topic of «Interaction Design with AI»?
Contact Larissa:
Interested in an exchange on the topic of «Interaction Design with AI»?
Contact Larissa:
How we measured.
Operational data: The basis is all support tickets from jls digital's service management system over twelve months, together with a snapshot of the content management system from the same day. A confirmed communication failure only counts as such when the screen was demonstrably dark; a connection loss does not qualify, because the player continues to play the last loaded playlist autonomously. Because dark screens are predominantly reported by people on site, this figure is a lower bound. Time metrics are based on closed SLA cycles and cover 74 percent of tickets. The root cause clusters are derived from a keyword analysis of ticket descriptions and reflect symptoms, not validated causes.
Audience measurement: The basis is anonymised sensor measurement in a retail banking network with more than ten locations over a full quarter. A viewer counts from one second of measured attention; a qualified viewer from two seconds. The reference unit for all proportions is the sensor-detected person, not the passing footfall at the location. No individuals are re-identified and no image data is stored; age and gender are estimated by the sensor and not collected. Every key metric was validated against a second independent source. All digital signage KPIs were validated against a second independent source.
Learn more about digital signage solutions.

Swisscom Reference

Blog Post: «Transparent LED»